How to Increase Your E-Commerce Conversion Rate in 2026
The average e-commerce conversion rate is 2-3%. That means 97 out of 100 visitors leave without buying. Here are the proven techniques to convert more visitors into customers.
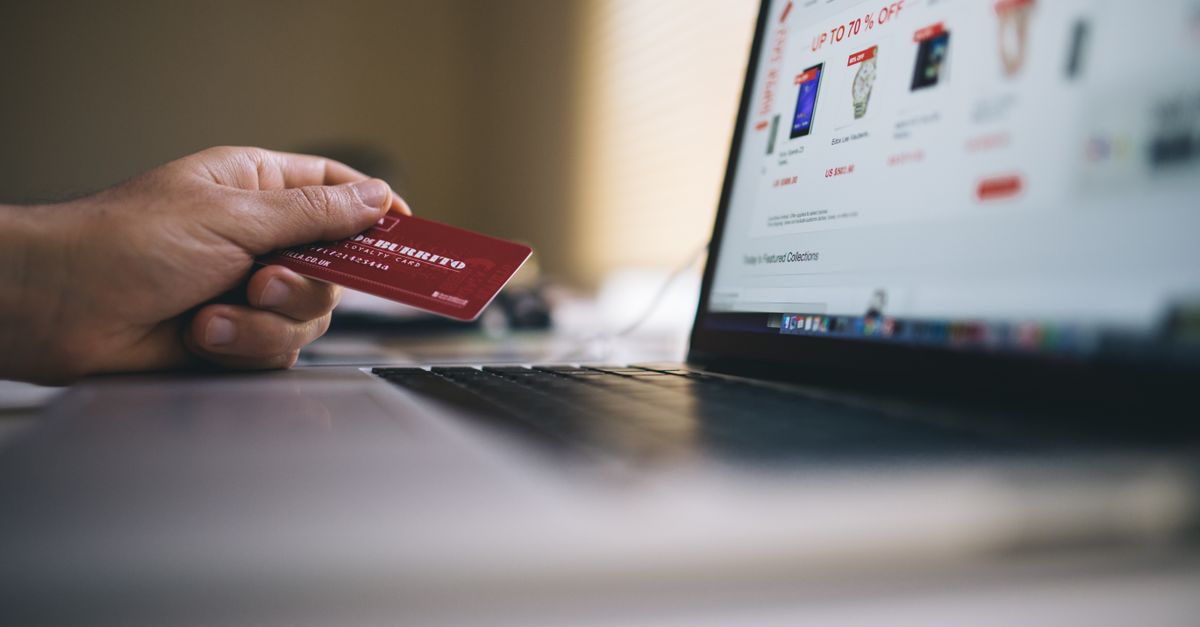
Photo : Negative Space / Pexels
The Real Metric That Determines E-Commerce Profitability
Read also— in the same topic: E-commerce
Free consultation
You have a project? Let's talk strategy.
30 min, no commitment. We analyse your situation and tell you what we'd do.
Most e-commerce business owners obsess over traffic. More visitors, more ads, more social media reach. It makes intuitive sense: more people in the store equals more sales.
But here's what the data consistently shows: the average e-commerce conversion rate sits between 1-4%. That means 96-99% of visitors leave without buying.
The difference between a 1.5% and a 3% conversion rate isn't a nice-to-have — it's the difference between a business that barely breaks even and one that's genuinely profitable. Doubling your conversion rate doubles your revenue without spending another cent on traffic.
This guide covers the specific, tested tactics that move e-commerce conversion rates in 2026.
Understanding Conversion Rate Optimization (CRO)
Conversion Rate Optimization is the systematic process of testing and improving your website to increase the percentage of visitors who complete a desired action — in e-commerce, that's usually completing a purchase.
The conversion rate formula:
Conversion Rate = (Number of Purchases / Total Visitors) × 100
Industry benchmarks by category (2026):
If you're below your category benchmark, CRO should be your #1 priority before increasing ad spend.
Stage 1: Fix What's Already Breaking
Before running experiments, audit for fundamental conversion killers.
Page Speed
In 2026, a 1-second delay in page load time reduces conversions by approximately 7%. For mobile users — who represent 65-70% of e-commerce traffic — a site that takes more than 3 seconds to load sees abandonment rates above 50%.
How to check: Google PageSpeed Insights, GTmetrix
What to fix: Image compression (use WebP format), server response time, render-blocking JavaScript, unnecessary third-party scripts
Mobile Experience
If your mobile checkout experience is clunky, you're losing the majority of your potential customers. Test your entire purchase flow on a real mobile device — not just a browser simulation.
Common mobile conversion killers:
Checkout Friction
Every additional step in checkout is an abandonment opportunity. The industry-standard checkout abandonment rate is 70%. The most common causes:
Stage 2: Product Page Optimization
The product page is where purchase decisions are made. Most conversion rate lift comes from improving these pages.
Product Photography
High-quality product photography is non-negotiable. Key requirements:
Brands that add 360° product views see 20-40% conversion lifts on those products.
Product Descriptions That Convert
Most product descriptions are written by people who know the product, not by the customer who's about to buy it. The result: spec sheets, not conversion copy.
What converts:
Pricing Psychology
Social Proof
Buyers trust other buyers far more than they trust brands. Social proof placement on product pages:
Urgency and Scarcity
Used ethically, urgency and scarcity genuinely improve conversion rates:
Used unethically (fake countdowns, perpetual "limited" stock claims), they erode trust when customers notice.
Stage 3: Shopping Cart and Checkout Optimization
Reduce Checkout Steps
The one-page checkout reduces the cognitive burden of purchase. Instead of shipping → billing → payment → review → confirm, consolidate into a single page.
If multi-step is unavoidable, use a clear progress indicator so customers know how many steps remain.
Guest Checkout
Forced account creation is the single biggest checkout abandonment trigger. Always offer guest checkout. After purchase, offer account creation as a convenience ("Save your details for faster checkout next time") rather than a requirement.
Payment Options
In 2026, offering only card payment is leaving money on the table. Consider:
Transparent Total Cost
Show estimated shipping costs as early as possible — ideally on the product page with a zip code input. Price shock at checkout (discovering €8 shipping after adding to cart) is a primary abandonment cause.
Abandoned Cart Recovery
Even after optimization, some carts will be abandoned. A triggered email sequence recovers 5-15% of abandoned carts:
SMS abandoned cart recovery outperforms email in open rates but requires opt-in consent.
Stage 4: Trust Building Across the Entire Site
A consistent trust environment across your entire site reduces the anxiety that prevents purchase.
Trust Signals Checklist
Return Policy
Counter-intuitively, generous return policies increase purchase rates more than they increase actual returns. When buyers know they can return easily, the perceived risk of purchase drops significantly.
Best practice: 30-day no-hassle returns with free return shipping increases conversion rates significantly, especially for apparel and shoes.
Stage 5: Personalization and Behavioral Targeting
As traffic scales, blanket CRO becomes less effective. Segmenting and personalizing experiences unlocks the next level of conversion improvement.
New vs. returning visitors: Show different homepage messages. First-time visitors need trust-building; returning visitors may need a specific offer to convert.
Traffic source-specific landing pages: A visitor from a Facebook ad about "summer dresses" should land on a summer dress collection page, not your generic homepage.
On-site personalization: Show recently viewed items. Recommend complementary products. Display "customers who bought this also bought" suggestions. These features increase average order value and reduce decision paralysis.
Exit-intent overlays: When a visitor's mouse moves toward the browser's close button, trigger a targeted overlay. Not a generic "10% off!" but something specific: "Still thinking about [product they viewed]? Here's why 847 customers loved it."
Stage 6: Post-Purchase Optimization
The transaction doesn't end at purchase. Post-purchase experience drives reviews, repeat purchases, and referrals.
Order confirmation page: Don't just say "thanks." Show the order summary, expected delivery date, and a clear path to customer service. Consider adding a referral incentive: "Share this with a friend and you both get 10% off your next order."
Transactional emails: Order confirmation, shipping notification, and delivery confirmation are opened at 60-70% rates — far higher than marketing emails. Use these to reinforce trust and suggest complementary products.
Post-purchase review requests: 48-72 hours after delivery, send a review request. Photo review incentives (small discount on next purchase) significantly increase review quality and quantity.
Measuring CRO Success
The only metric that matters: Conversion rate by segment (new visitors, returning visitors, mobile, desktop, by traffic source).
Supporting metrics:
Testing protocol: Never rely on gut feeling. Use A/B testing tools (Google Optimize, VWO, Convertize) to validate changes. Run tests until you have statistical significance (minimum 95%) before implementing winners.
A 0.5% conversion rate improvement on 10,000 monthly visitors with an €85 average order value = €42,500 additional annual revenue. CRO is worth the investment.
→ Get a free CRO audit for your e-commerce site from Flowify
Need expert guidance?
Flowify helps businesses worldwide build high-performing digital products. Contact us for a free audit.
Get a free quoteGet the next ones by email
Practical articles on web, SEO and automation. No sales pitch, unsubscribe in one click.